One of the ways that I listen to gentrification’s impact on the vitality of go-go is through mapping. Go-go music is created and sustained through daily practice, and through mapping, I mark the places that go-go has frequented past and present, and also consider where it’s headed.
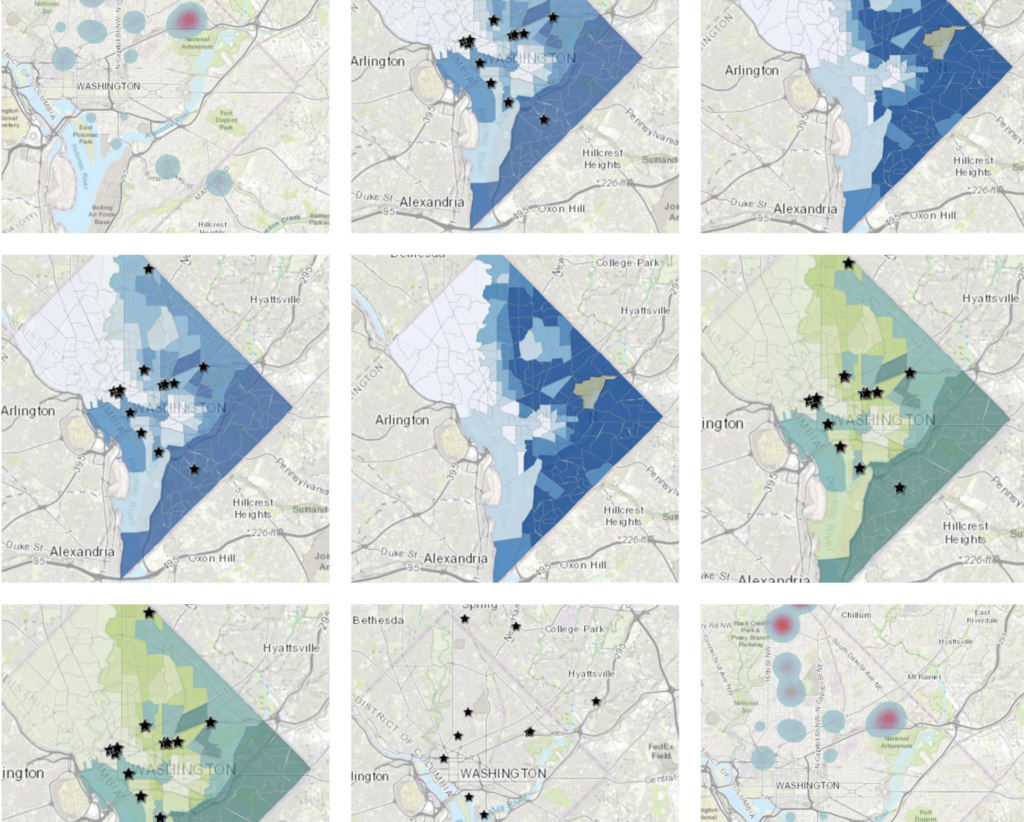
Here I offer a series of maps that consider that same question: “how has gentrification impacted go-go music in DC?”. The maps are as follows: First, a series of three that show go-go venues against the black population percentage of the city for 1990, 2000, and 2010. Second, a time lapse that tracks year by year how venues have opened and closed, with the specific venues dropping on or off the map as they go. Finally, I include a heatmap based on a discography in progress, that shows the frequency of shows at various venues through the years.